M&A / Equity Transactions
As noted above, Q4 announced outbound M&A aggregate value was USD 31.5 billion, down 12.5% from the USD 36.0 billion in Q3 but still 35% above the rolling 5-quarter average. While aggregate value decreased, volume increased by 15.3%, to 196 transactions, our investments highest total ever. This quarter there were 10 transactions of at least USD 1 billion, totalling USD 15.5 billion (versus 8 transactions with an aggregate value of USD 21.6 billion in Q3).
Average deal size (excluding equity investments below USD 10 million with disclosed transaction value) declined from USD 358 million to USD 282 million in this quarter, again clearly middle market focussed.
Aggregate Value
Financials led again with USD 12.3 billion representing 39% of the aggregate value. This sector recorded 6 transactions in excess of USD 1 billion including 4 transactions in Real Estate including the acquisition by Evergrande of three property-owning entities (Hong Kong – USD 2.1 billion) and of Pioneer Time Investment (Hong Kong – USD 1.6 billion), acquisition by Anbang Insurance of Fidelity and Guaranty Life (US – USD 1.6 billion) and of a 20.5% stake in Sino-Ocean Land Holdings (Hong Kong – USD 1 billion), acquisition by China Shipping Container Lines of Florens Container Holdings (Hong Kong – USD 1.2 billion) and acquisition by China Life of a 30% stake in US warehouse operations (USD 1 billion).
Utilities ranked 2nd with USD 5.6 billion (18% of aggregate value), with the two largest transactions of the quarter: the acquisition of Edra energy assets (Malaysia) by China Nuclear Power for USD 2.3 billion and the acquisition of Pacific Hydro (Australia) by China’s State Power Investment for more than USD 2 billion. Following Utilities in aggregate value were Consumer (12%) and Technology (9%). Collectively, these 4 sectors accounted for 78% of Q4 aggregate amounts.
Geographically, Asia ranked #1 in aggregate value, accounting for 49%. For the 3rd consecutive quarter North America ranked 2nd with 26% while Europe dropped from almost 50% to 13% of aggregate value. Collectively, these three regions represented almost 90% of Q4 aggregate value.
Volume
North America led again in volume with 75 announced transactions/investments (38% of volume), followed by Asia with 61 (31%). North America volume was once again driven by investments in Technology and Health Care (collectively accounting for more than 50% of US volume).
Technology, Consumer and Financials accounted for around 60% of total volume. Technology and Consumer ranked 1st with 40 transactions each (20%), followed by Financials (18%). In terms of volume Utilities represented only 5%.
Government Related Loan Agreements
In Q4, there were 26 Government Related Loan Agreements (up from 19 in Q3) representing USD 17.875 billion aggregate commitments (up 4% from Q3). However, unlike in the prior two quarters, countries along the official OBOR route received only 60% of committed amounts and only 46% of volume. Along OBOR, Pakistan received four loans, Vietnam three loans and Indonesia two loans. Loans to Pakistan represented 30% of aggregate commitments, while loans to Indonesia represented 23%.
The Indonesia infrastructure loan, the largest in Q4, was structured in a highly creative way, with the Indonesian Government bearing no credit risk.
Loans to African countries represented 42% of volume. There were four loans to Zimbabwe, three loans to Zambia and one each to Ivory Coast, Kenya, Senegal and South Africa. There has been considerable speculation that Chinese lending to Africa has "dried up" - Q4 numbers show otherwise - although these loans appear to be focussed on renewable energy, infrastructure and IT - the same focus as OBOR country loans.
Government Agreements
Q4 Government Agreements saw a decline in amounts pledged to USD 59.6 billion, down from USD 73.5 billion in Q3. While volume was up slightly from 6 to 8 countries (33.3%), there was also a very clear focus on key strategic partner relationships and on key industries.
For example, agreements with Germany and France, core European partners, represented 73.8% of aggregate amounts. Over 90% of such amounts of the German agreements were related to the purchase of planes/helicopters manufactured in Germany. Similarly, over 90% of the aggregate amounts of the French agreements were related to nuclear energy.
There were also another round of pledges to Kazakhstan, a key OBOR partner, and, in much smaller amounts, to Vietnam and Cambodia.
South Africa, Zimbabwe and Liberia combined for over USD 10 billion pledges in Q4. Again, most of these pledges centered on loans for infrastructure, renewable energy and IT.
II. Quarterly Feature: Special Chinese Policy Loans Study (2013 – 2015)
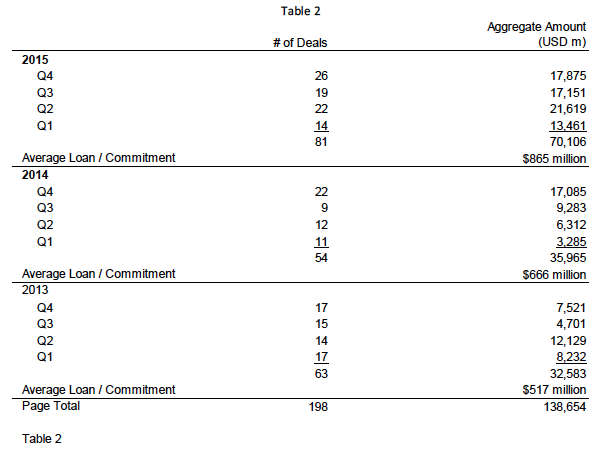
In our continued efforts to track China's pledges of policy loans embedded within much larger Government Agreements versus actual funding, during the past quarter we analysed 198 Chinese policy bank loans, representing nearly $140 billion signed/committed during the period of 1 January 2013 through 31st December 2015.
While we are not planning to release the results of this study (which we believe will demonstrate increasing focussed country management during this period) until the end of January, we did want to at least release various underlying statistics in this quarterly document.
Some initial observations on this population include the following:
Volume increased from 63 in 2013 to 81 in 2015, representing a 13.4% CAGR. Arithmetic mean volume over the past five quarters was 20.6 loans per quarter.
Aggregate amounts more than doubled from $32.583 in 2013 to over $70.106 billion in 2015. This represents a 46.7% CAGR. The past 5 quarters saw an arithmetic mean of $15.8 billion per quarter.
Similarly, average loan/commitment has increased from $517 million in 2013 to $865 million in 2015, a 29.3% CAGR.
It is worth noting that virtually all of this growth occurred before the launch of AIIB, the Silk Road Fund and the Silk Road Gold Fund, all of which are now formed and are in the process of becoming operational.
While the primary purpose of this analysis is to track the lag time (in quarters) between the quarter of the pledge within the respective Government Agreement and when the actual loan was committed / signed, we thought that it would be interesting to show our readers the comprehensive size of the loan data being analysed in advance of releasing the formal study.
Overview of Grisons Peak
Grisons Peak LLP is a London based merchant banking firm specializing in a number of sectors including financial services (including real estate), pharmaceuticals, infrastructure and consumer. We provide independent advice on cross border M&A, ECM and high yield issues, both public and private. We also selectively co-invest in equity stakes alongside our clients. In the area of merchant banking, Grisons Peak has invested in 7 client related investments across Europe, Asia and the Americas. We have exited two of these to date realising gains in both cases.
We operate via joint ventures and partnerships throughout Europe, the Middle East, Africa and in North Asia. Since its founding in 2003, the firm has advised on over €25 billion transactions across three continents. In the Advisory area, over the past 28 months, the firm has advised on 11 completed transactions and on 18 binding offers, mostly in emerging markets. In the Advisory area, we focus on transaction execution since virtually all of the firm's clients have done business with Grisons Peak or representatives of the firm previously. We also do not advertise as we are very discreet regarding our Advisory clients (hence only a 1 page website for this business).
Grisons Peak LLP launched and began publishing our quarterly research product China Outbound Investments in 2008. While other major database services track Chinese outbound M&A/Equity investments, our Chinese research is unique in that we monitor and analyse M&A/Equity in the context of much larger Government Agreements and Government Related Loan Agreements. Our research has been cited by major financial media including the Financial Times, The Wall Street Journal, Reuters, IFR, Bloomberg, FT Confidential, Euromoney, IFR Asia and The Independent.
We also proudly hold the distinction of having our firm's research cited by two important Chinese Government press; Xinhua and China Daily, on two unrelated very visible Chinese policy issues. We frequently release prior investment banking analyses over a section titled “Special Studies”; another link between the two businesses. We have also collaborated with New York University in econometric research on Chinese outbound investments into the USA. We see our firm’s USP as providing unique research and analytical skills in both of our core businesses.
Grisons Peak LLP is Authorized and Regulated by the Financial Conduct Authority.