Since the announcement of formation of the Asian Infrastructure Investment Bank (AIIB), there has been considerable debate in some circles over China's historical track record on policy loans.
Since our firm already enters Chinese Government Related loans into its China outbound database, we decided to expand our standard entries into a formal study covering several aspects of each loan/commitment. Our study thus includes all Chinese bank policy loans issued by CDB and CEXIM commencing the quarter after the September and October 2013 the proposed strategic concept of building the New Silk Road Economic Belt and the 21st Century Marine Silk Route. Please note that this analysis does not address geopolitical issues, rather focuses from a banking perspective on lending commitments and performance over a defined time period.
In this regard, our firm recently completed a study of 70 Chinese government related loans (3 loans for $5.7 billion are still pending so excluded from our totals) during the period of 1st January 2014 through 31st March 2015 since the November 2013 One Belt, One Road inclusion into an official document of the 18th Central Committee of the CPC.
I. Pro forma Portfolio Composition by Continent
We begin our analysis by examining the construction of the pro forma portfolio of commitments totaling nearly $50 billion made during this period by continent and by average size.
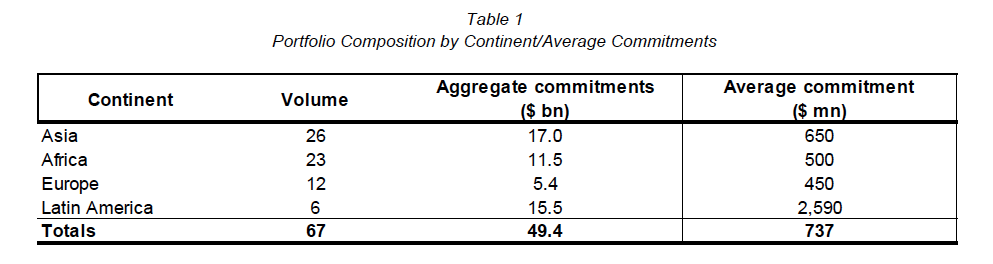
As shown above in Table 1:
- Asia led in volume with 39% of total volume, followed closely by Africa with 34%. When including Europe’s 12 loans, 91% of volume occurred in these three continents;
- Asia also led with $17.0 billion aggregate commitments which represents 34% of committed loan amounts during this time period;
- Latin America led in average loan size, with $2.6 billion per average credit facility. These were clearly focussed in Argentina and Ecuador. All other loans across the One Belt, One Road area were in the $500-$650 million range;
Recent financial press have argued that Chinese government related loans have become increasingly focussed on assisting countries which have been adversely affected by major oil price declines. In fact, only 12 of the 67 loans over the past five quarters (17.9% of volume), with an aggregate value of $21.8 billion (44% of aggregate value) were made to Ecuador, Argentina and Russia, countries whose GDP have been hit hard by such declines.
It is also worth noting that virtually all of the $6.3 billion loans made to Russia were specifically designed to facilitate trade finance involving many Chinese based corporates rather than loans directly related to Oil & Gas or Financial (see Tables 2 and 4 for more detail).
II. Loans by Industry/Classification
In this section, we analyze this pro forma portfolio by industry classification. As see in Table 2 below, all 67 commitments fall within 5 major classifications (3 industries plus Trade Finance and Financial).
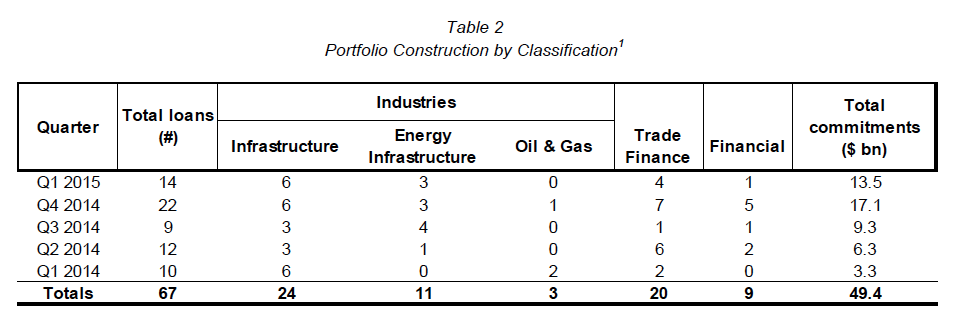
Infrastructure/Energy Infrastructure (which we include power plants, transmission/distribution networks, nuclear fuel cycle and hydroelectric power), led with 52% of total volume. Collectively, these classifications led volume in four of the five quarters analysed. In addition, they combined for 61% of aggregate commitments.
Trade Finance represented 30% of total volume and 23% of total commitments. As with the percentages of Infrastructure / Energy Infrastructure above, these are in line with norms for policy banks.
Financial commitments (under which we include commitments to Funds, Corporate Defeasance and to Governments without any allocated purpose) represented 13% of total volume but only 10% of total commitments.
Pure oil & gas commitments represented less than 5% of volume and around 6% of total commitments during this period.
III. Correlation with One Belt, One Road
We then wanted to measure the correlation between the location of commitments in this pro forma portfolio with the One Belt, One Road strategy.
In order to do so, we have utilised the One Belt, One Road map published by Xinhua on 28th March, 2015, the same day as President Xi Jinping's speech at the Boáo Forum. For additional detail, we also interposed the three spurs of the European Silk Road as published in China Daily on March 16th 2015.
We have excluded plotting the six loans to Latin America as these fall outside One Road, One Belt.
Footnotes:
1 A small percentage of the loans fell into multiple classifications. We included the overall loan in one specific category; however, the relevant amounts were allocated into the total commitments column
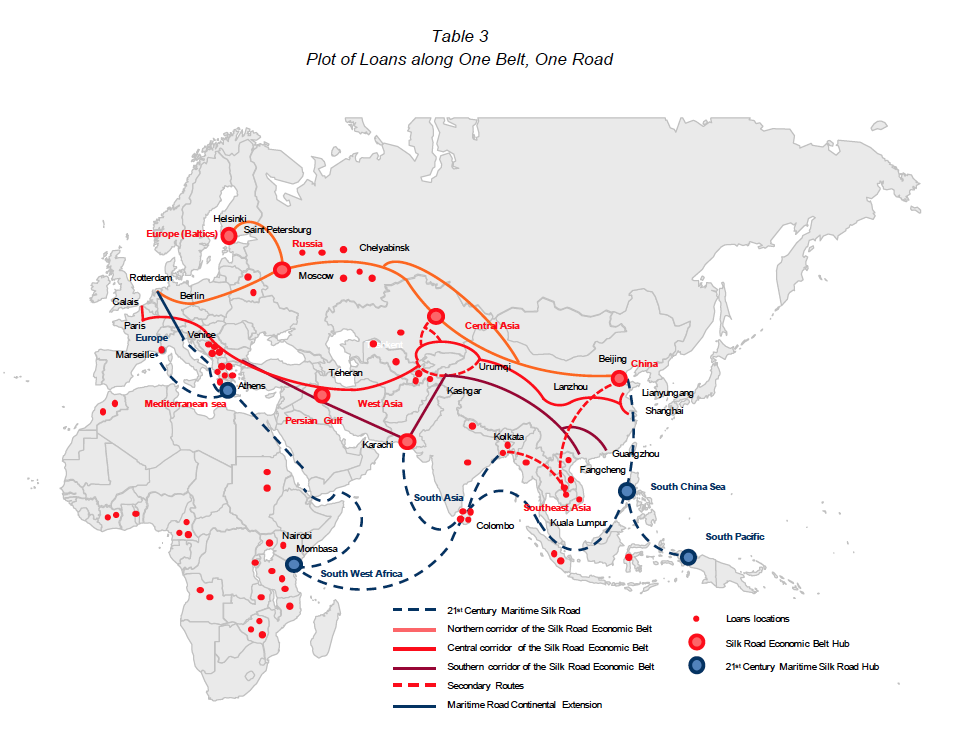
Visually, with the exception of loans/commitments to Western African countries, there appears to be a strong correlation between the pro forma portfolio of commitments over this period and the One Belt, One Road route (designed to bind together 65 countries and 4.4 billion people).
After removing the 6 Latin American loans and the 10 Central and Western African loans, 76% of the pro forma portfolio volume was in or near portions of One Belt, One Road.
While one swallow does not a summer make; by this test alone, China's policy loans during this time period seem clearly aligned with China's One Belt, One Road strategy.
IV. Context within overall Policy Bank Lending Trends
It is important to note the above loan commitments in light of overall developments within the two major Chinese policy banks, China Development Bank (CDB) and The Export-Import Bank of China (CEXIM).
CDB net new loans peaked in 2011 at RmB 987.4 billion, a 27.7% rise from 2010. Since the 2011 peak, CDB net new loans have declined annually, by 15.6% in 2012, by 16.9% in 2013 and by 12.3% in 2014 to RmB 608 billion. While there is insufficient data to show net new international commitments per year, we do have data which show that in 2013 outstanding foreign currency loans rose 14%. Collectively, such loans represented over 20% of CDB's total exposures at year end 2013.
Conversely, CEXIM has shown a very different trend, albeit from a much lower base. Since the 2010 amount of RmB 128.3 billion in net new loans and advances, CEXIM has experienced sizeable increases annually.
In 2011, there was an 82.2% increase, followed by an 18.7% increase in 2012 and a smaller 5.7% increase in 2013 (at the time of this study, 2014 data is not available).
Relative to profitability, in 2013, CDB produced nearly RmB 80 billion net profit, up 26.7% from 2012. CDB also produced 15.1% ROE. In 2013 CEXIM produced RmB 4.3 billion consolidated profit, up 12.4% from 2012. CEXIM had 19.4% average ROE in 2013. Clearly these are profitable financial institutions.
V. Changing Financial Terms and Conditions
Loan performance has been excellent, especially when compared with the major Chinese commercial banks. CDB's 2013 NPL ratio was 0.48%, up from 0.30% in 2012 but well below 2010's ratio of 0.68%. CEXIM's 2013 NPL ratio was 0.28%, up from 0.12% in 2012 but well below the 0.42% in 2010. It is important to note that CEXIM's 1998 NPL ratio was 14.19%, falling consistently over 8 years to stand at 3.47% at year end 2006.
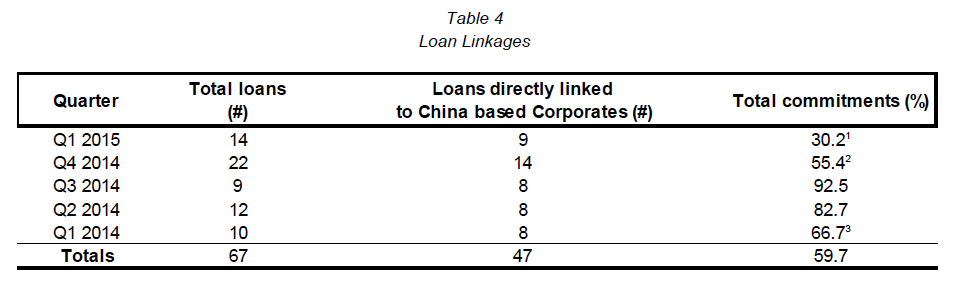
We believe that one of the reasons underlying low NPLs are the direct linkages between the loans/commitments to China based corporates. While we mentioned this previously in the context of commitments to Russia during this period, Table 4 is a much more thorough analysis. It shows that 70% of the volume and 60% of total commitments had a direct link to a China based corporate. While this is standard for Trade Finance, which is short-term secured credit, it seems to have become standard in this pro forma portfolio in Infrastructure/Energy Infrastructure commitments.
Despite such strong financial performance and security/linkages, Chinese policy banks also implemented a number of measures to further improve portfolio performance during the period. One of these was to increase interest/coupon rates on selected loans. For example, we have noticed a near doubling of coupons over this period. Early in the period, rates seemed to average (when disclosed) of 2.0-2.5%. The CEXIM loan to Uganda in Q1 2015 had an interest rate of 4%, double the average rate throughout our analysis. The Belarus loan in Q2 2015 was reportedly at 4.7%.
In addition to increasing rates, in 2014 the Chinese Government and its policy banks began tightening, leading to reduce commitment facilities and in some cases, even reducing existing facilities. We list three specific examples below:
- The Government of Zimbabwe requested $10 billion in new credit facilities, including a $4 billion payment upfront. China agreed to grant $2 billion in new credit; all of which was fully secured by future Zimbabwean mining tax revenues;
- South Sudan was granted a new $1 billion credit facility, down 50% from its initial request in December 2013;
- The Government of Ghana, after months of negotiations, agreed to only draw only $1.5 billion of its 2011 $3 billion loan facility. The 2011 loan was designed to release $1billion/year, so was on course until the agreement was terminated;
Footnotes:
1 Does not include $7 billion commitments where linkages were not disclosed upon announcement, but will likely surface later
2 There were 5 Financial loans this quarter with no direct linkage as well as a $2 billion loan to Angola, an important oil exporter to China
3 Although Kazakhstan gas and Indonesian nickel pig iron are used by China, there was no direct Chinese corporate linkage
VI. Conclusion
This analysis has set out a series of tests on a pro forma portfolio of Government policy loans extended during the 5 quarters since China's announcement of One Belt, One Road. We set out below our findings under each section:
- Table 1 showed that 91% of all commitment volume was located across Asia, Africa and Europe. Asia led with 39% of volume and 34% of committed amounts; Africa followed with 34% of volume and 23% of total amounts, while Europe (mostly CEE and Greece) had 18% of volume;
- Table 2 indicates that the pro forma portfolio was focused on Infrastructure, Energy Infrastructure and Trade Finance; all of which are consistent with loans made by other Trade/EXIM banks;
- Table 3 shows that 76% of the volume of all commitments extended during the 5 quarters were in or near countries along One Belt, One Road;
- Table 4 shows, over the period, the two Chinese policy banks which were already performing well, implemented a series of management actions to enhance future performance. These included increasing rates on some loans, reducing requested amounts on other loans and even terminating prior commitments. Finally, 70% of all volume and 60% of all loans/commitments made during this period were directly linked to at least one China based corporate. These percentages exclude other loans which were indirectly linked with to China's energy/commodity needs further protecting future portfolio performance.
In short, all of the above indicate sound banking management.
One criticism of China historically is that its funding pledges have not followed its commitments. For example, a Rand Corporation study of China's pledges during the period of 2002-2011 shows that during this period, especially from 2006-2011, China funded less than 20% of its aggregate international pledges, with some countries realising even lower percentages.
We readily acknowledge that the loans/commitments we have analysed are much younger and not subject to similar seasoning, however we believe that the trends set out above send powerful messages for industry observers to watch closely as China continues its outbound march, in particular, along One Belt, One Road.
Methodology:
In assembling this analysis, we used investment banking analytical standards exclusively. All data was gathered from public sources, which required considerable time and resource. Whenever possible, all data was reconciled with data released by CDB and CEXIM. When this was not possible, we used numerous public sources, global, national, regional and by industrial sector.
We only included loans which were signed and announced (as in M&A deals) and thus excluded all MOU's, agreements in principle, or agreed but not signed by both counterparties. We also included only outbound loans. We thus excluded CEXIM's $1.5 billion investment into the previously announced China-CEE Cooperation Fund as well as the $4.0 billion new credit facility for Venezuela, which came from the China Fund, formed in 2008. We included face amounts for each loan and while these can vary over time (see Section IV), all of these loans were signed within the past 5 quarters, hence limiting the impact of default.
PRESS ARTICLES 2015
- 12 December 2015 China to aid indebted African sovereign
- 25 November 2015 China’s New Silk Road Dream
- 22 October 2015 – Chinese investment along One Belt One Road revealed
- 16 October 2015 – Why we should hold out a friendly hand to China
- 10 Sep 2015 – Bangladesh favours Japan for port and power plant, in blow to China
- China Takes Its Debt-Driven Growth Model Overseas, 6 August, 2015
- 1 July 2015 – Massive Chinese lending directed to Silk Road
- 15 June 2015 – Chinese overseas lending dominated by One Belt One Road strategy
- 31 May 2015 – Chinese policy banks perform better since launch of Belt and Road Initiative
- 31 May 2015 – Belt and Road Initiative – Xin Hua
PRESS ARTICLES 2014
- 30 September 2014 – The signs are that Balfour Beatty has not yet reached the bottom – The Independent – Ben Chu
- 26 to 28 September 2014 – Terra Parzival Michaelmas 2014 Council Meeting!
- 28 August 2014 Zhang Chunyan in London and Zheng Yangpeng in Beijing – China Daily Europe
- 16 July 2014 – Nationale Suisse
- 27 February 2014 – Ukraine a setback in China’s eastern Europe strategy – Financial Times – James Kynge
- 20 February 2014 – Could China’s credit hangover prove to be a headache for HSBC? – The Independent – Ben Chu